Lean Six Sigma Storytelling

The Midnight Bakery

A professional, easy-to-read story guide that teaches the Seven Quality Tools, DMAIC, TIMWOOD, 5S, Kaizen, Poka-Yoke, and the cost of quality through Luna's late-night bakery turnaround.

BCOR-440 / IE-425 Created by Dr. Benyawarath "Yaa" Nithithanatchinnapat Brain & Bot style reading edition

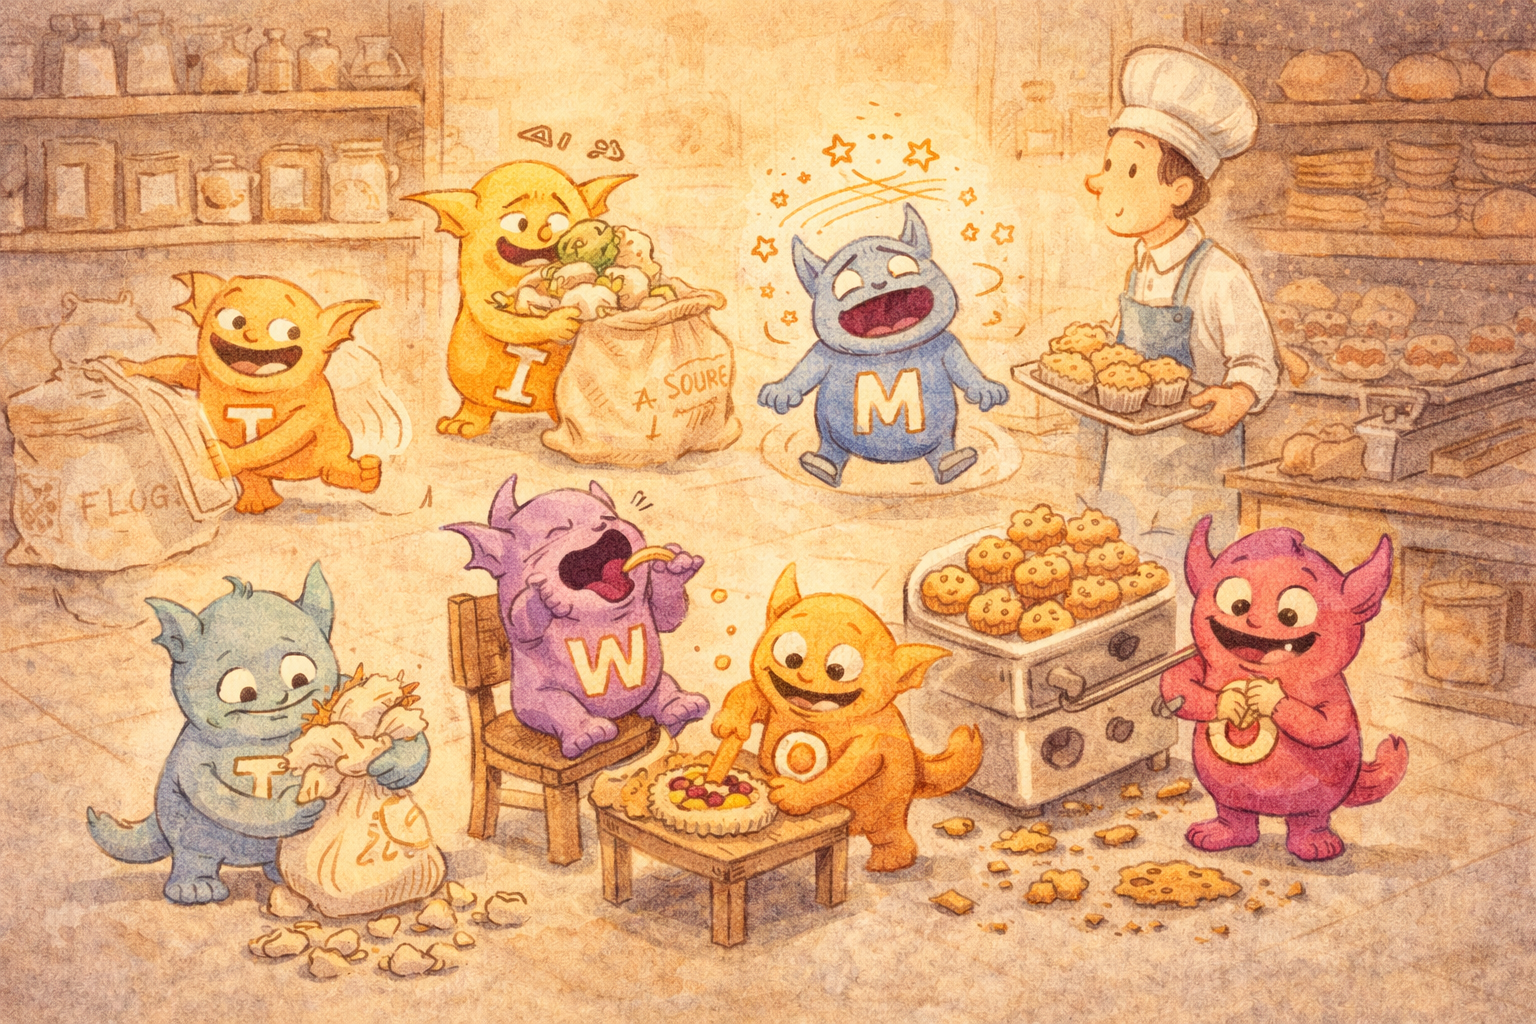
Why this story works

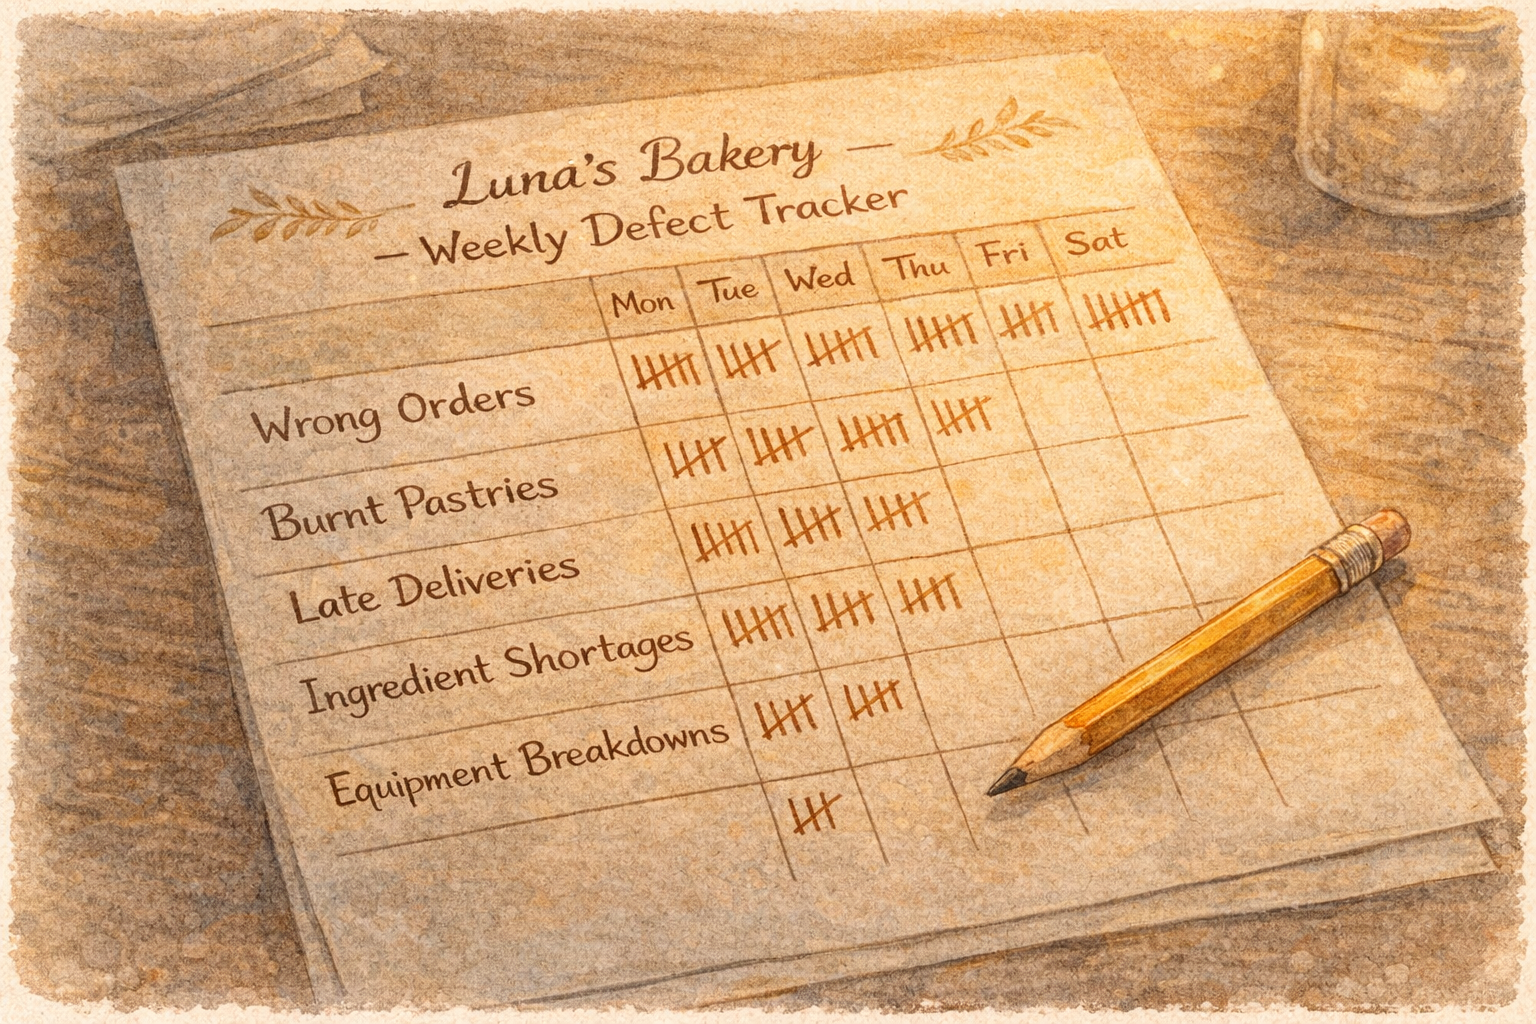
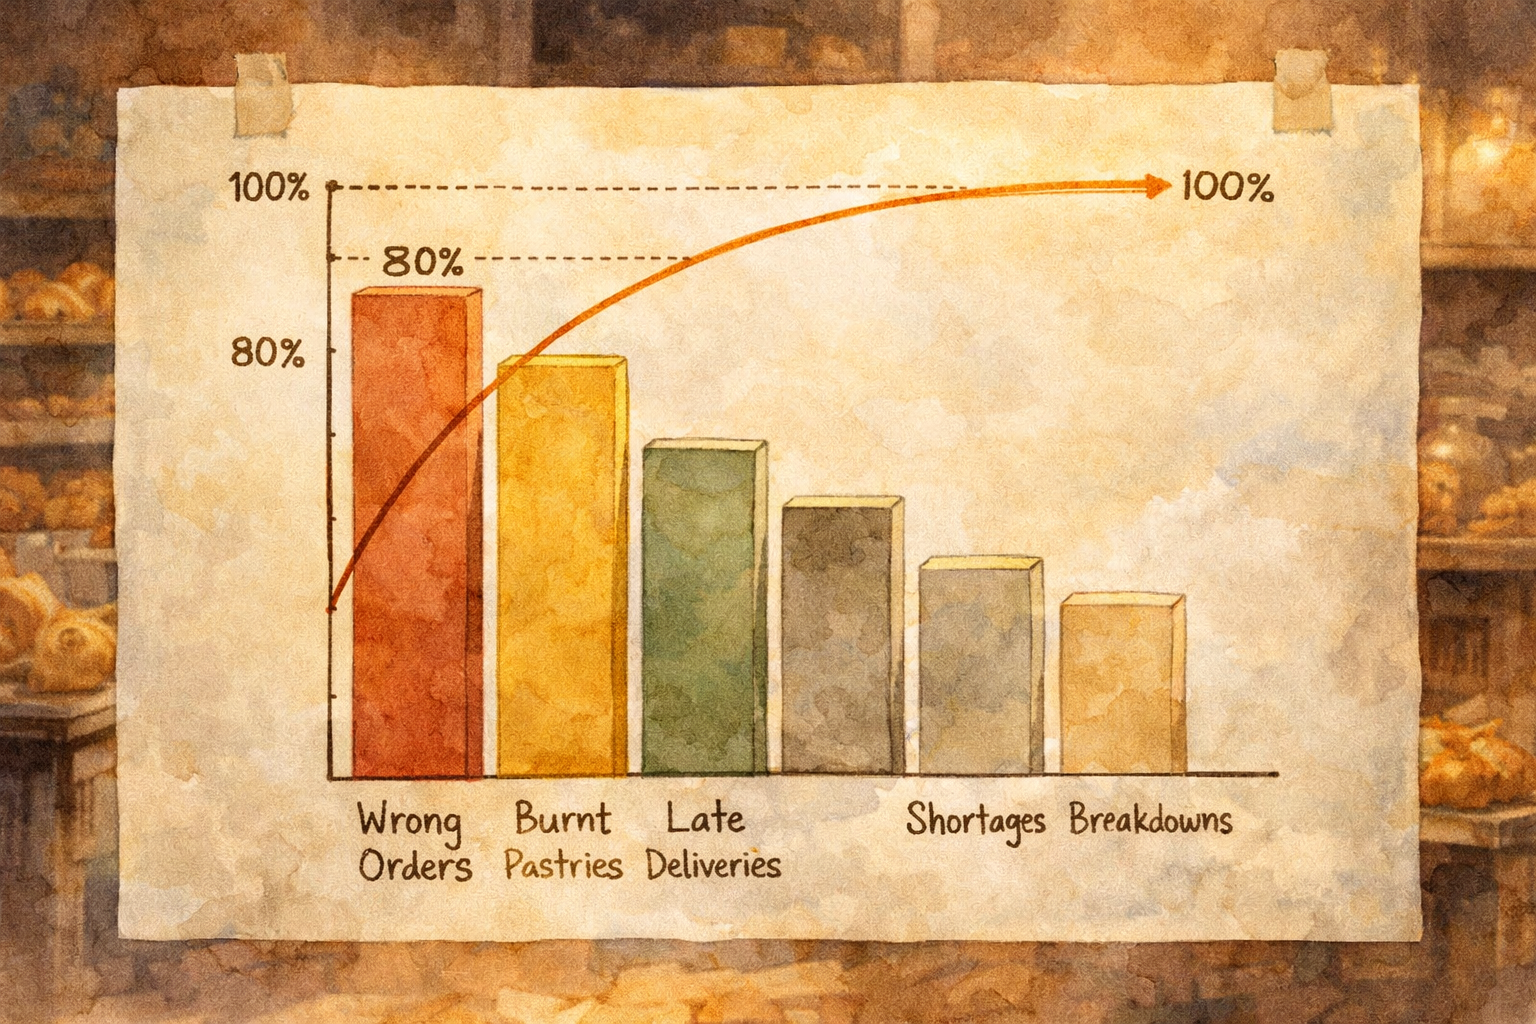
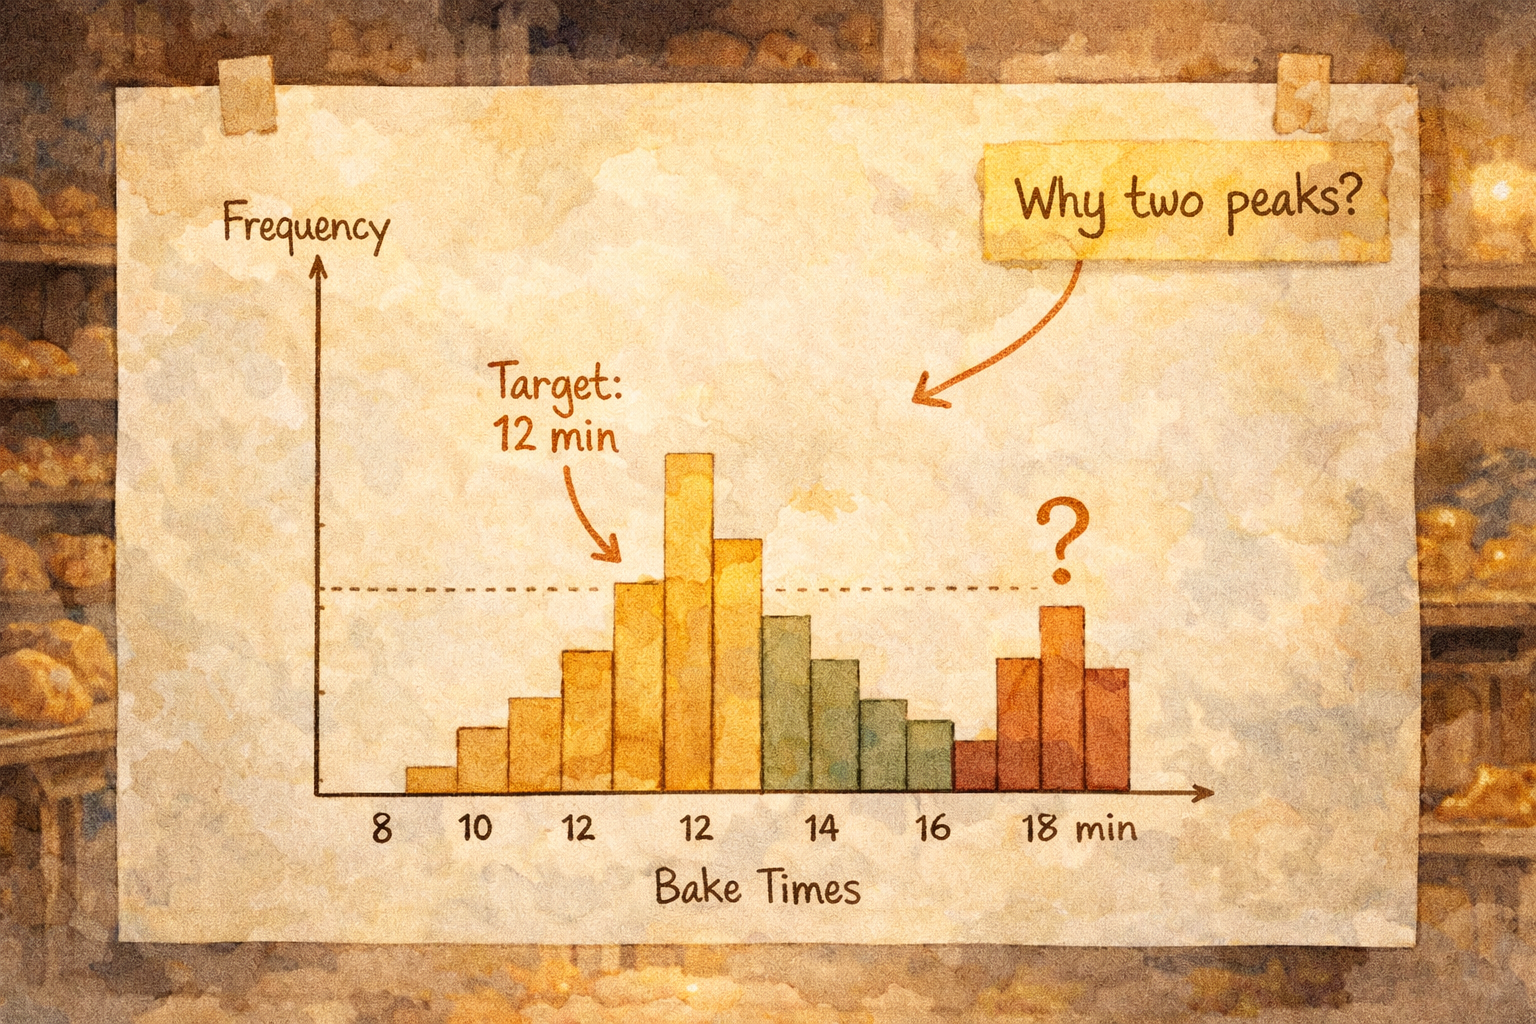
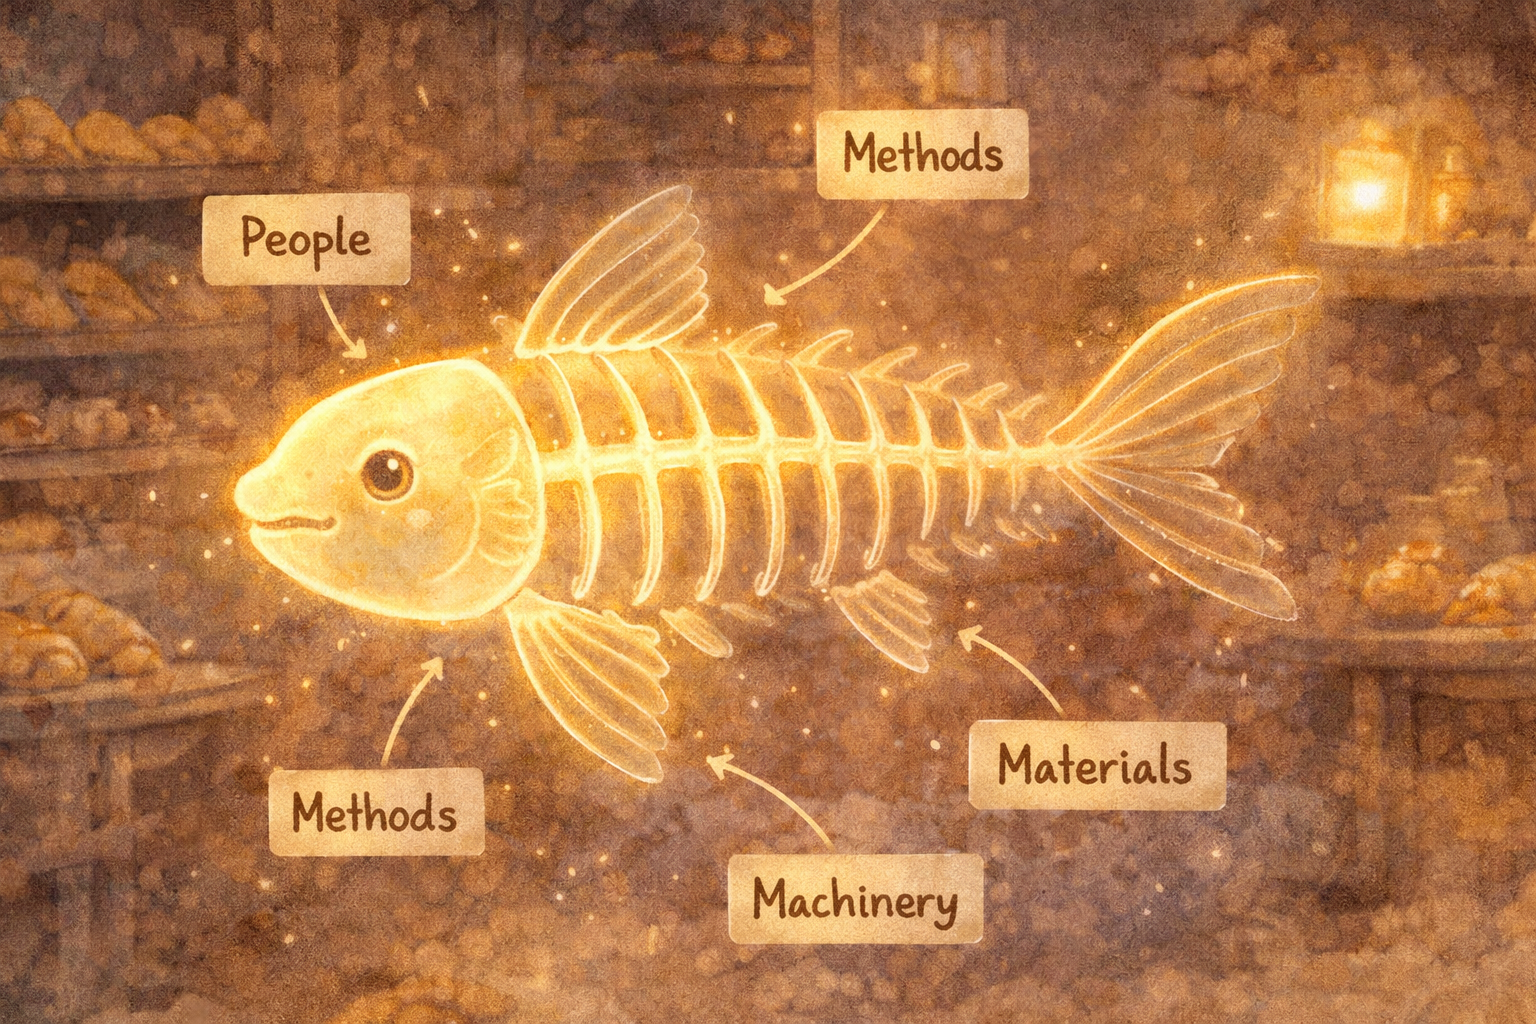
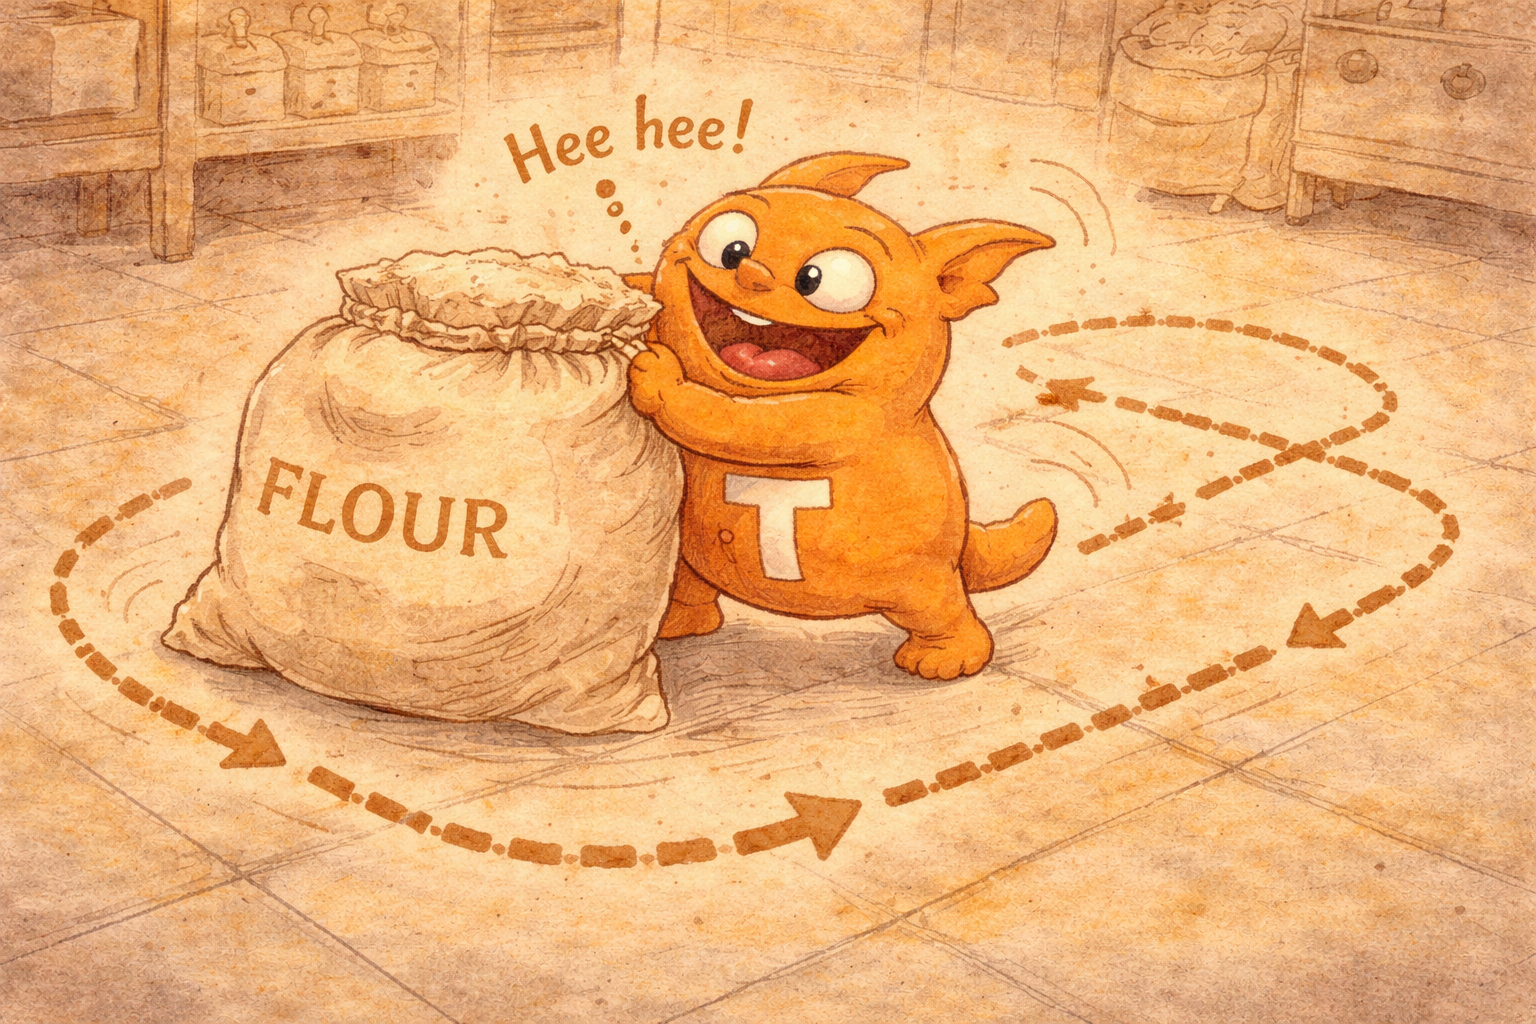
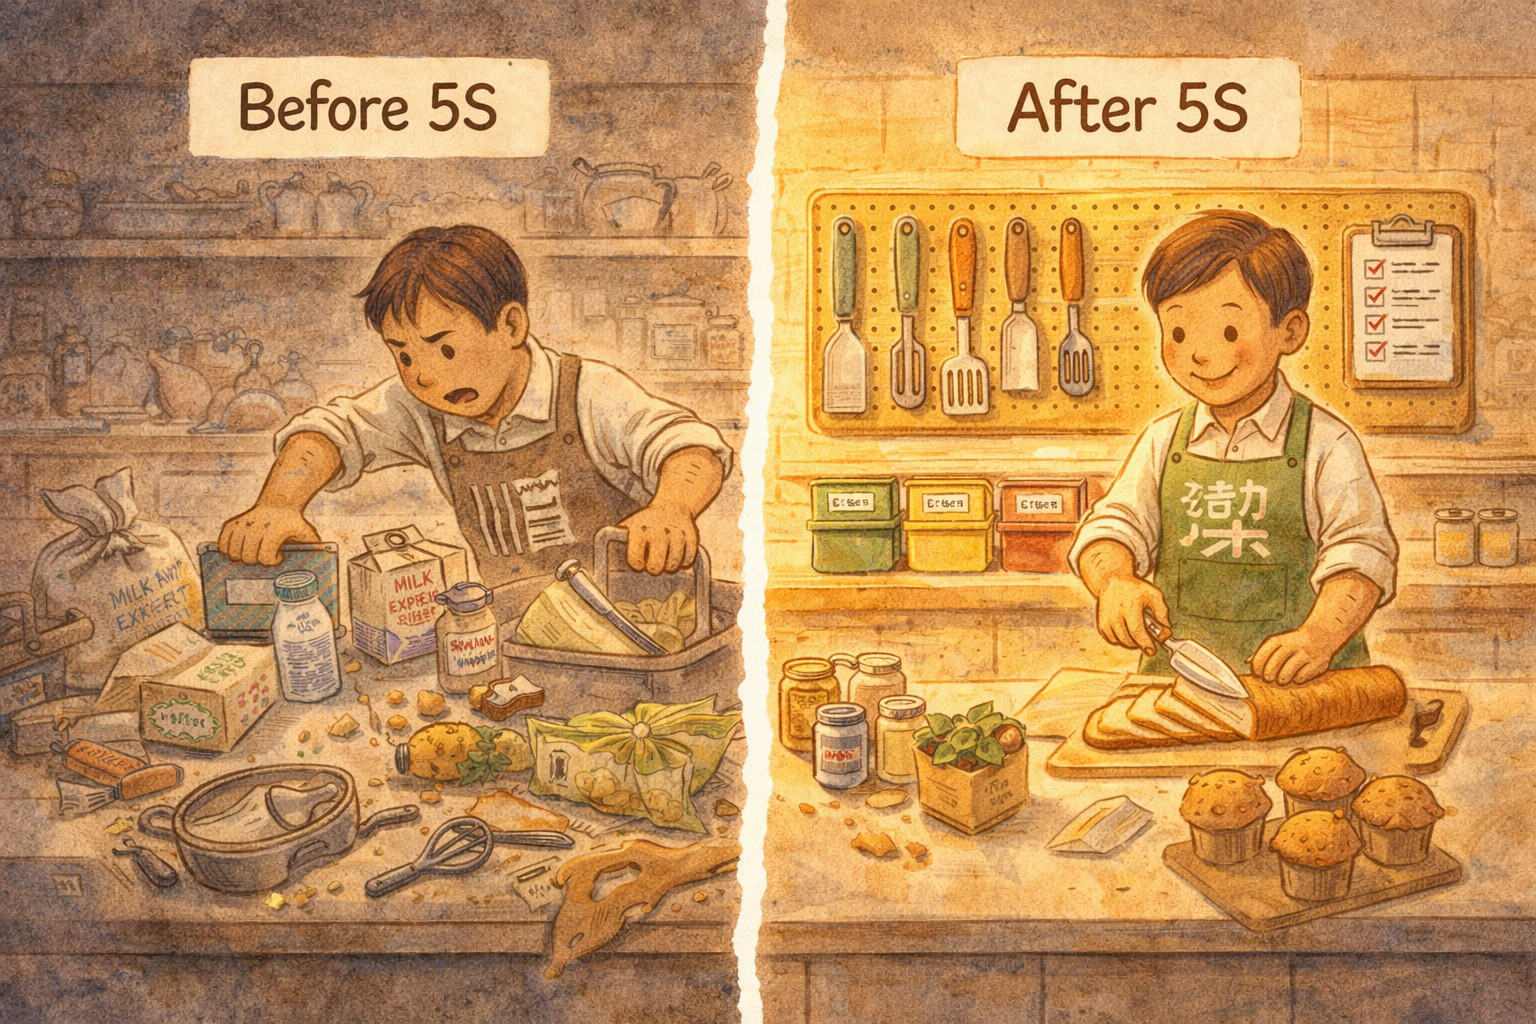
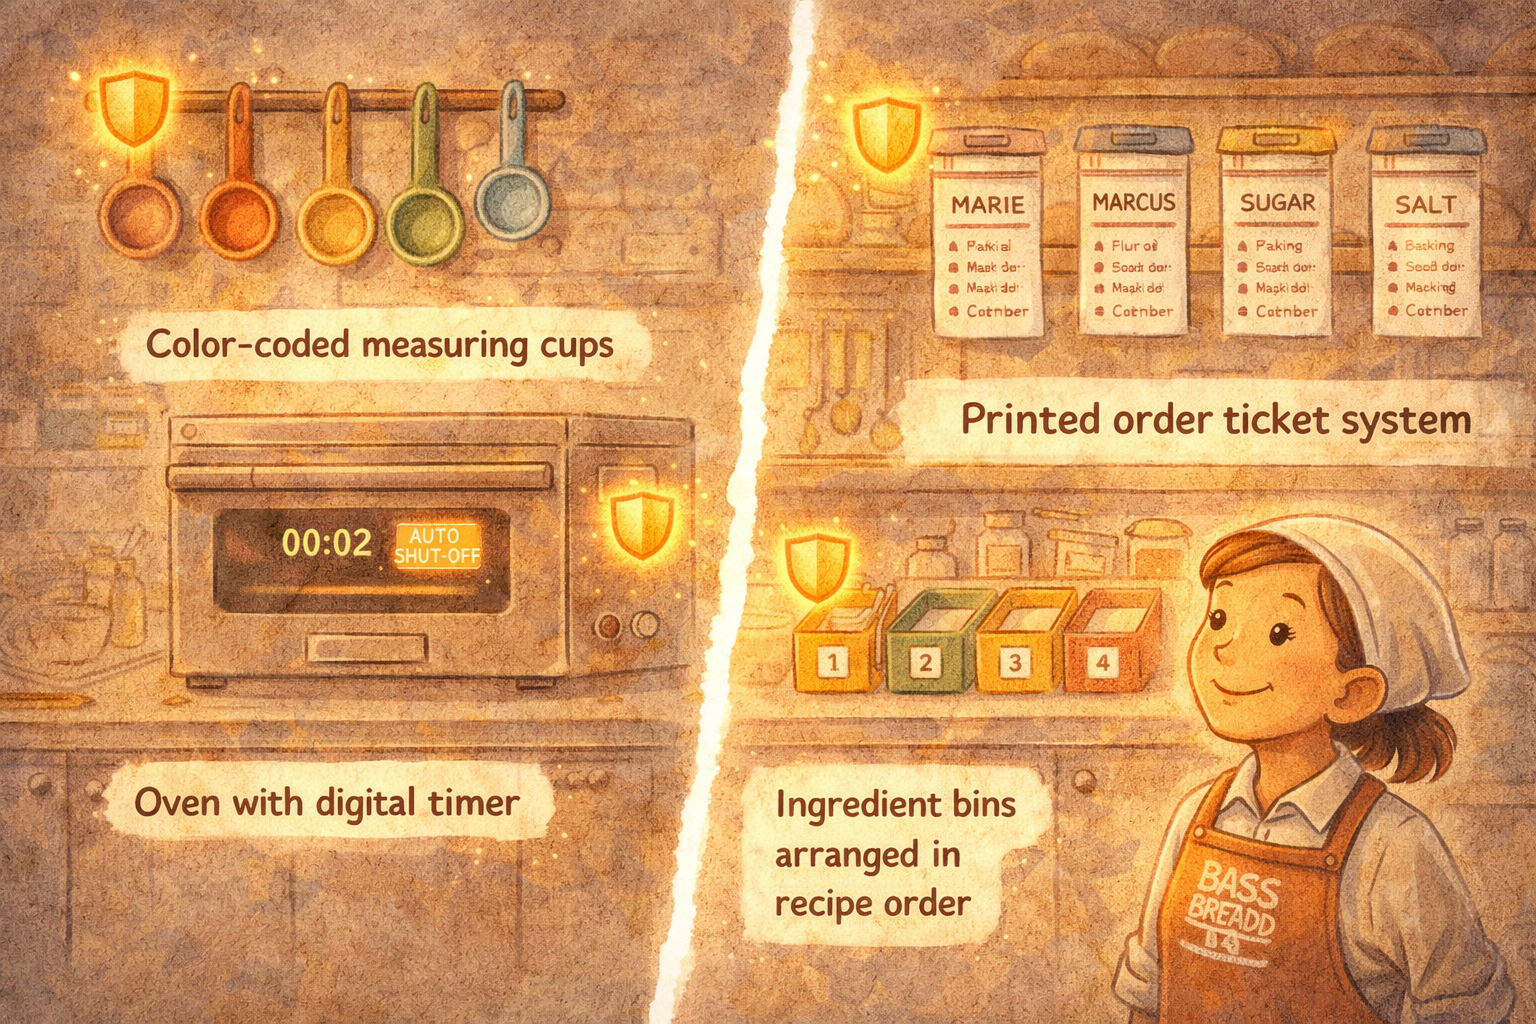
Instead of presenting Lean Six Sigma as disconnected definitions, the story anchors each concept in a bakery problem students can picture: wrong orders, burnt pastries, cluttered workstations, waiting time, and preventable mistakes. That makes the tools easier to remember and easier to apply.
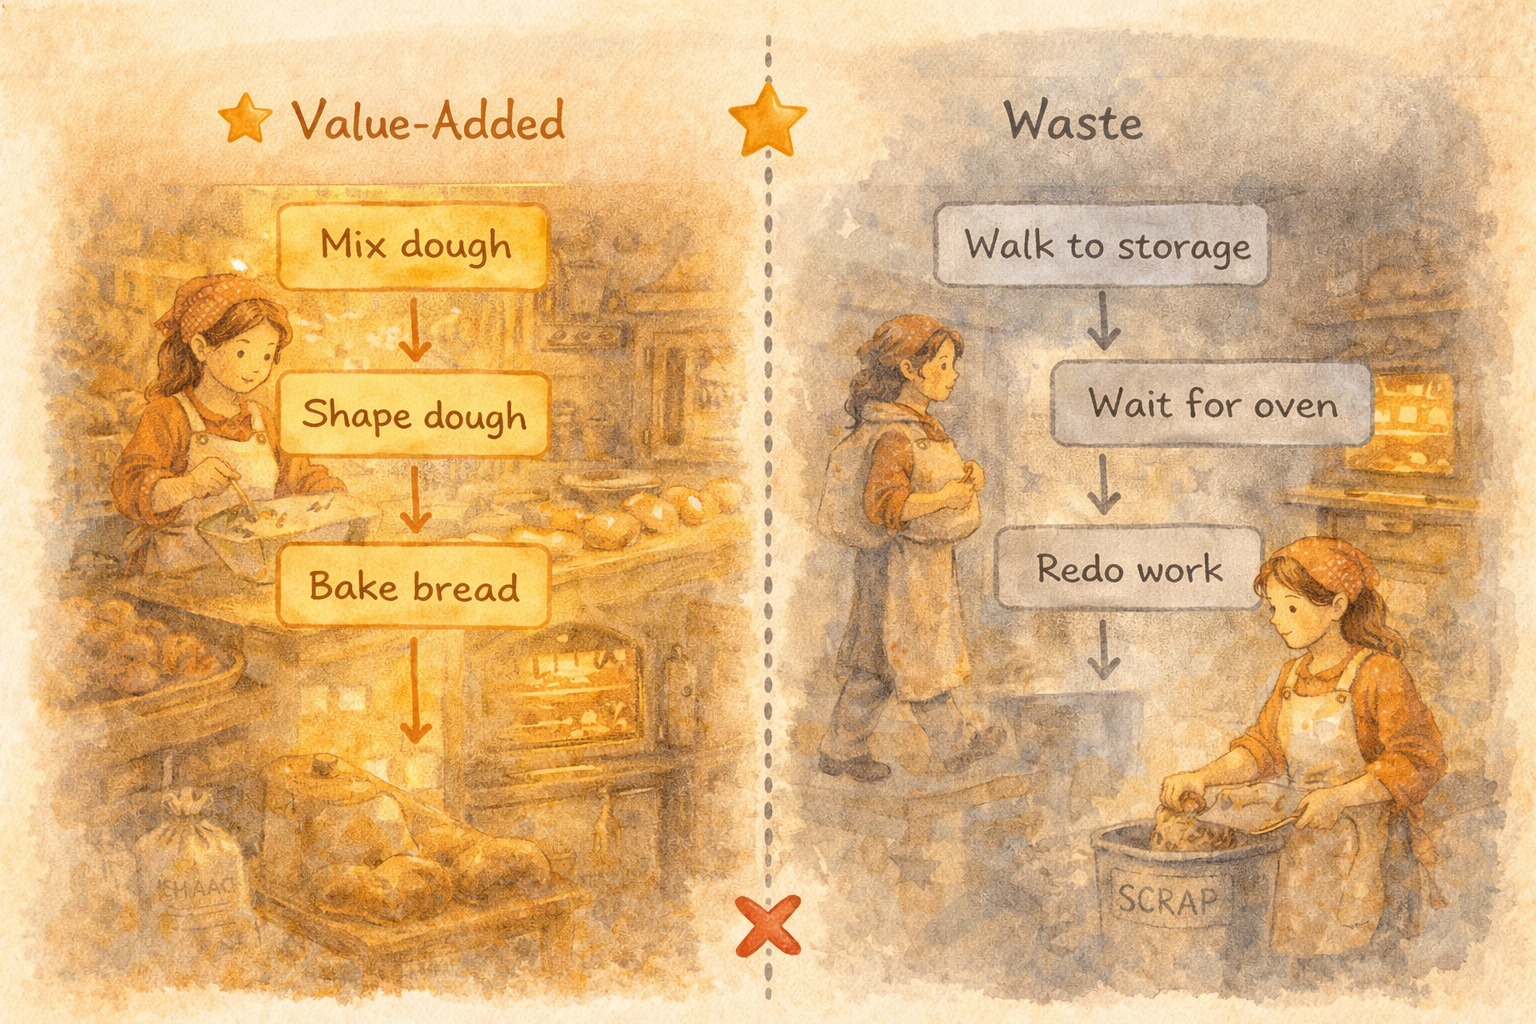
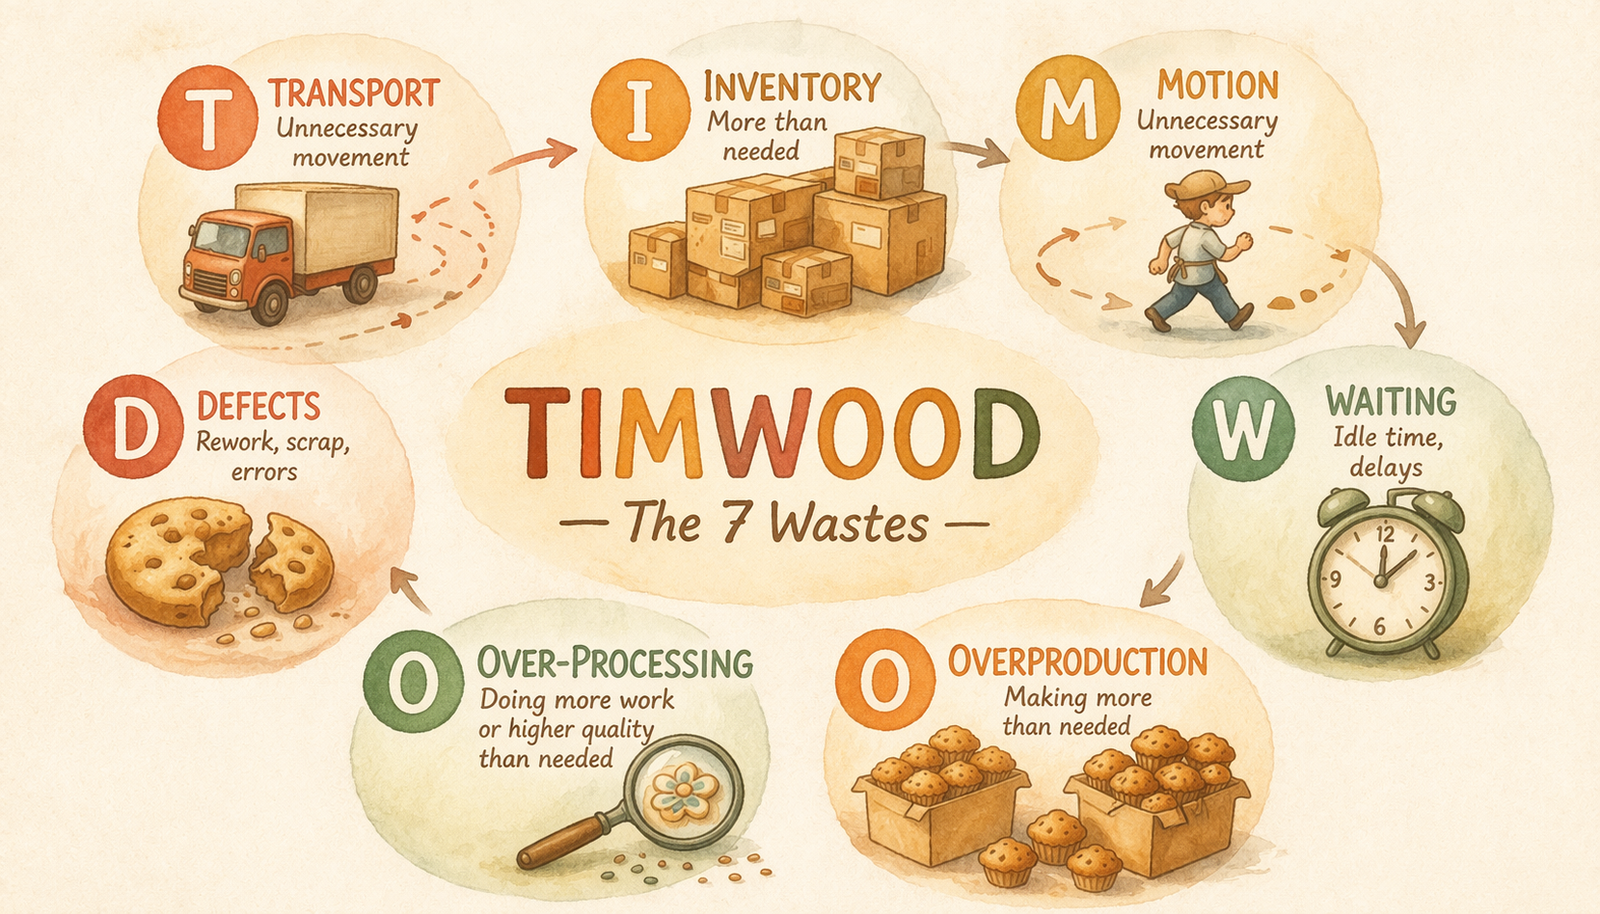
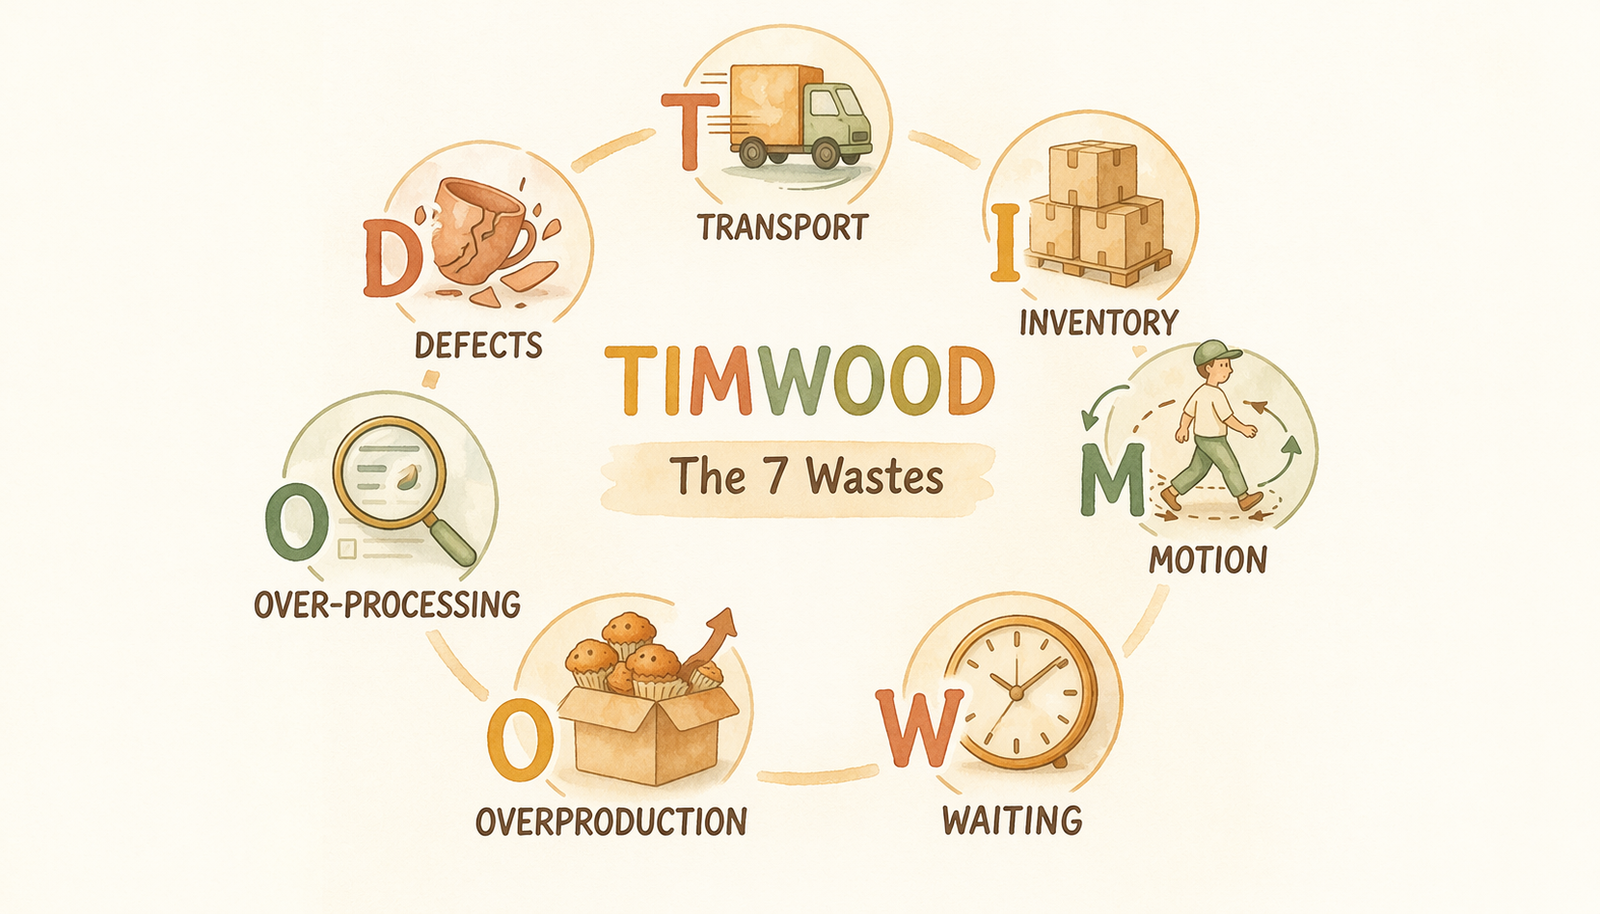
Lean Eliminate waste and improve flow so more work creates real customer value.
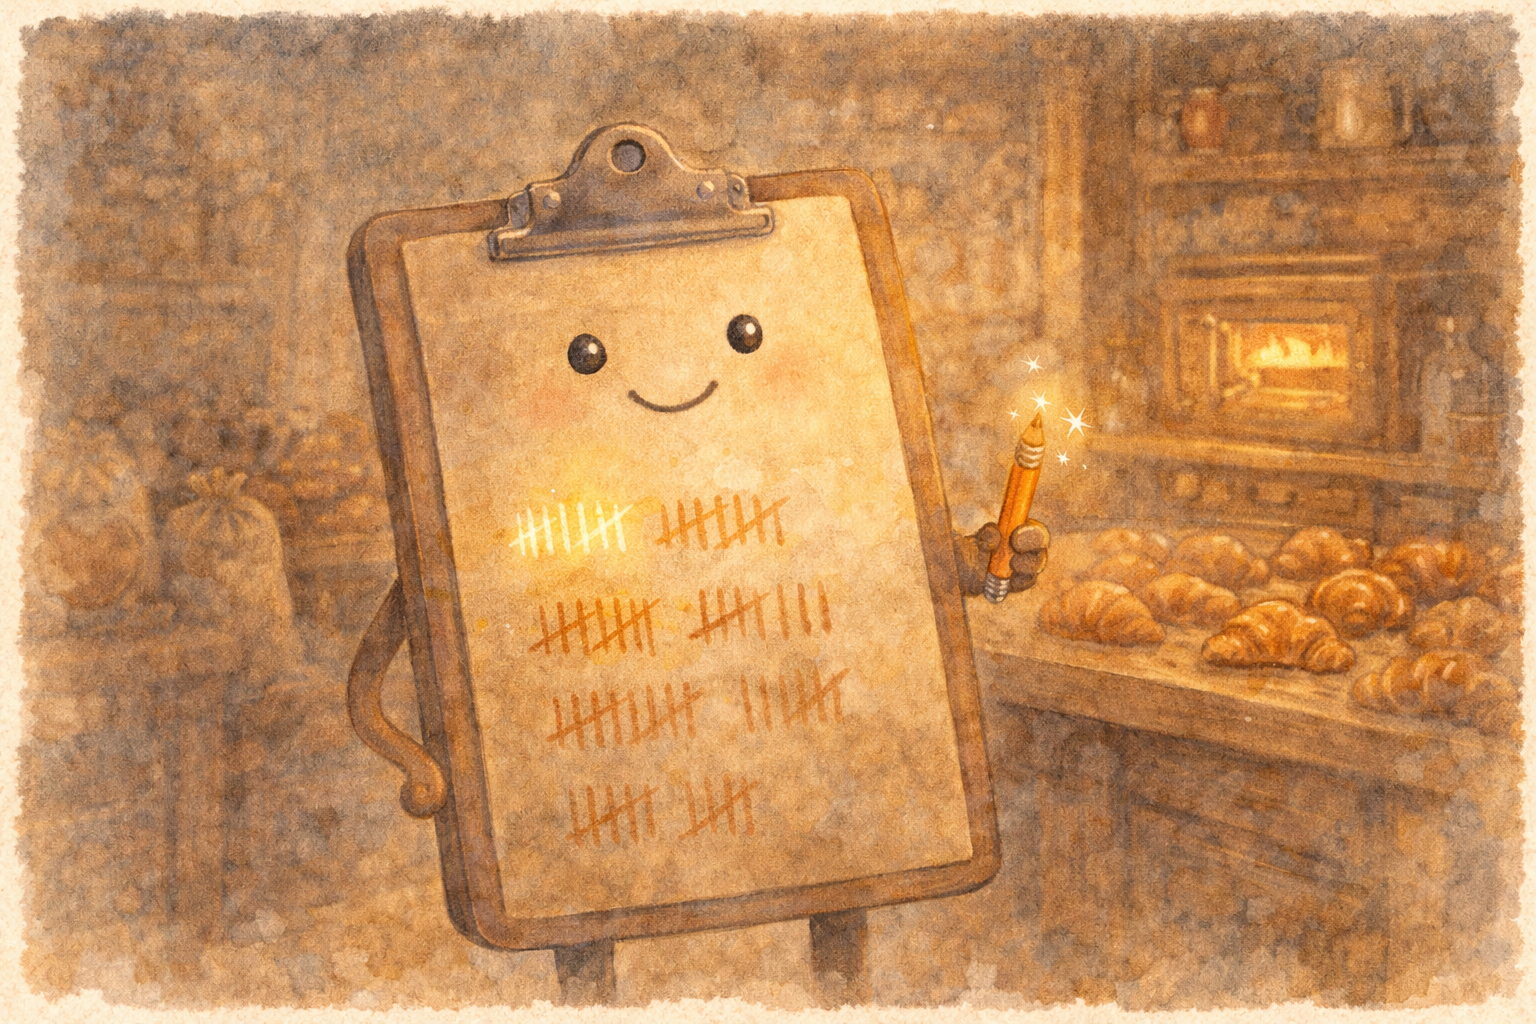
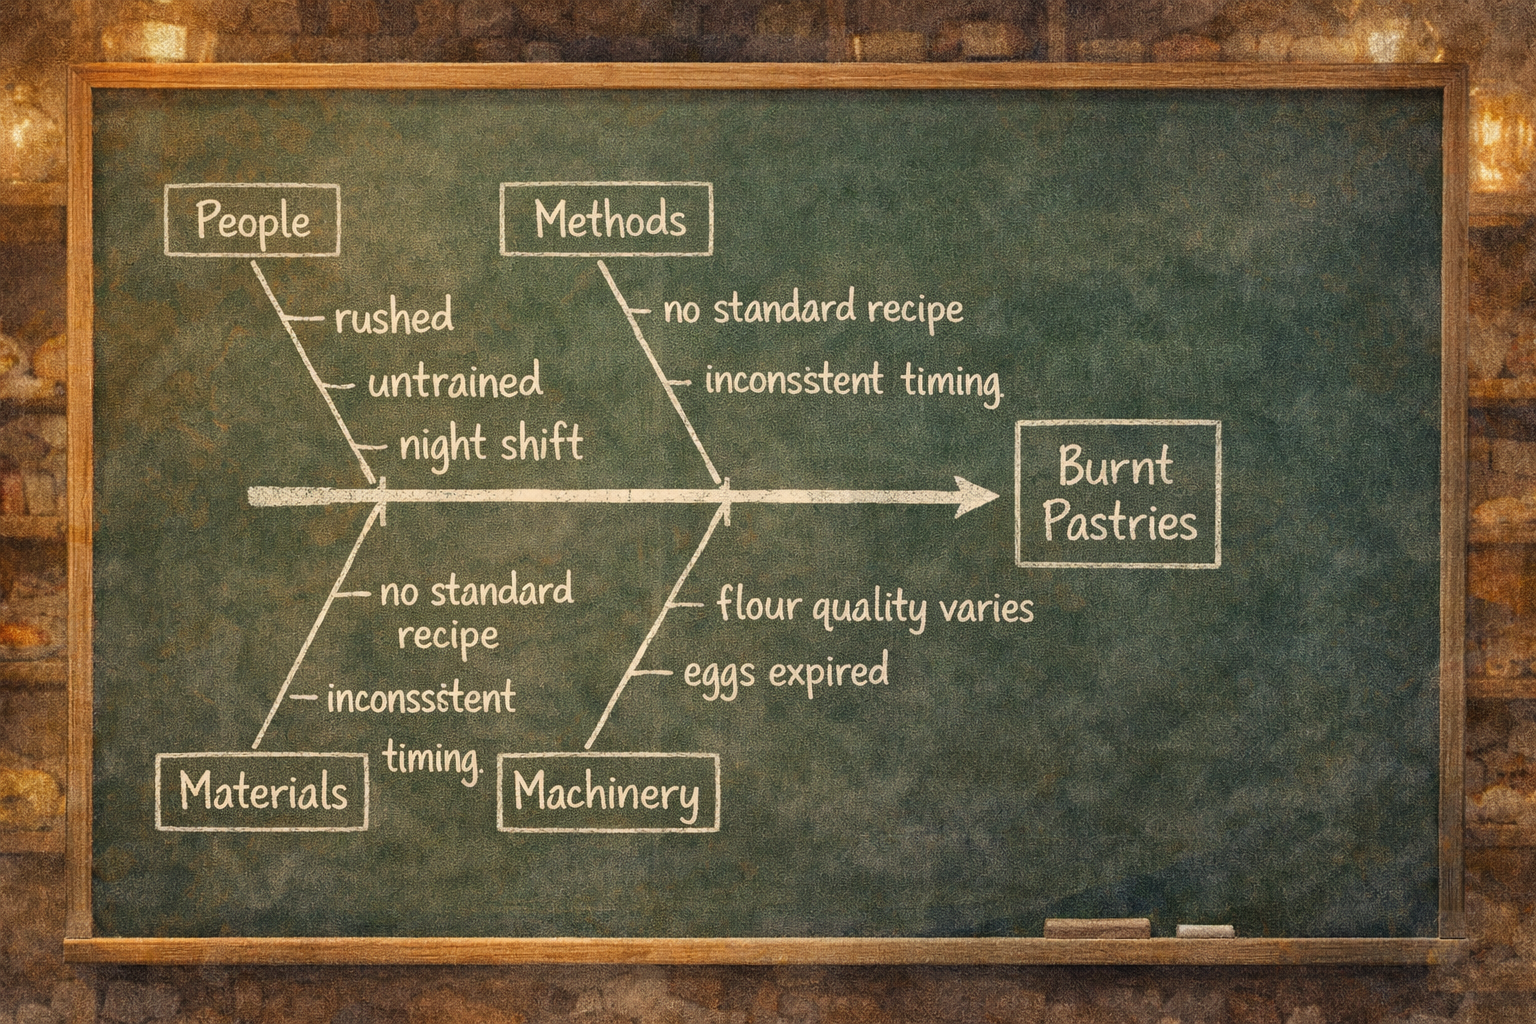
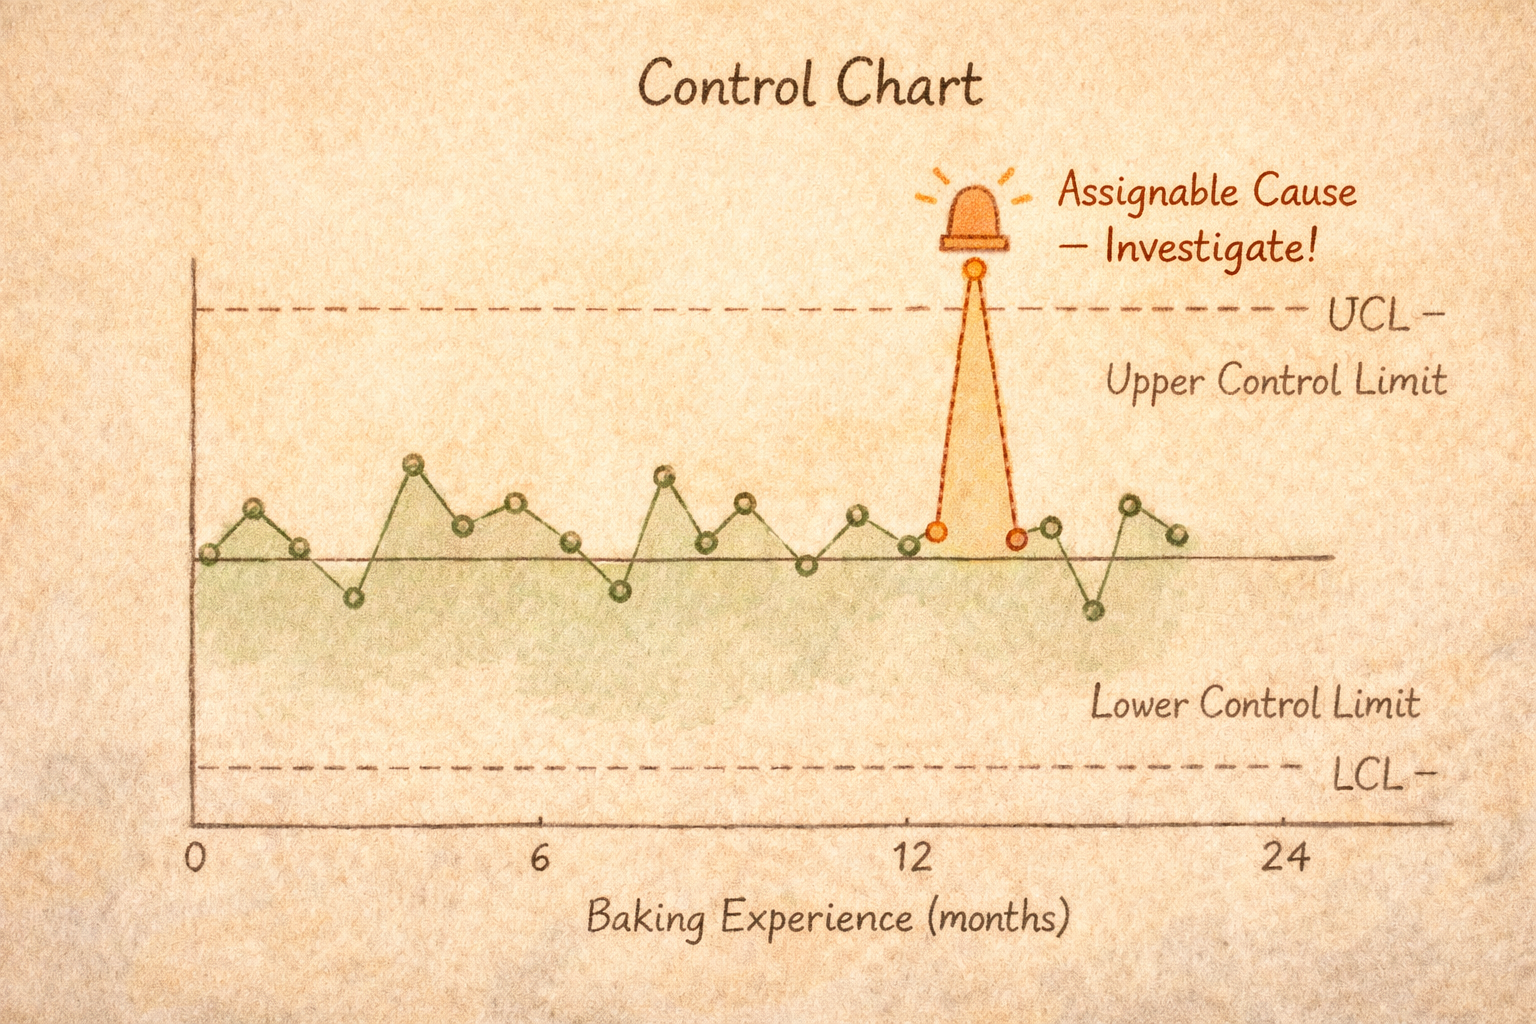
Six Sigma 
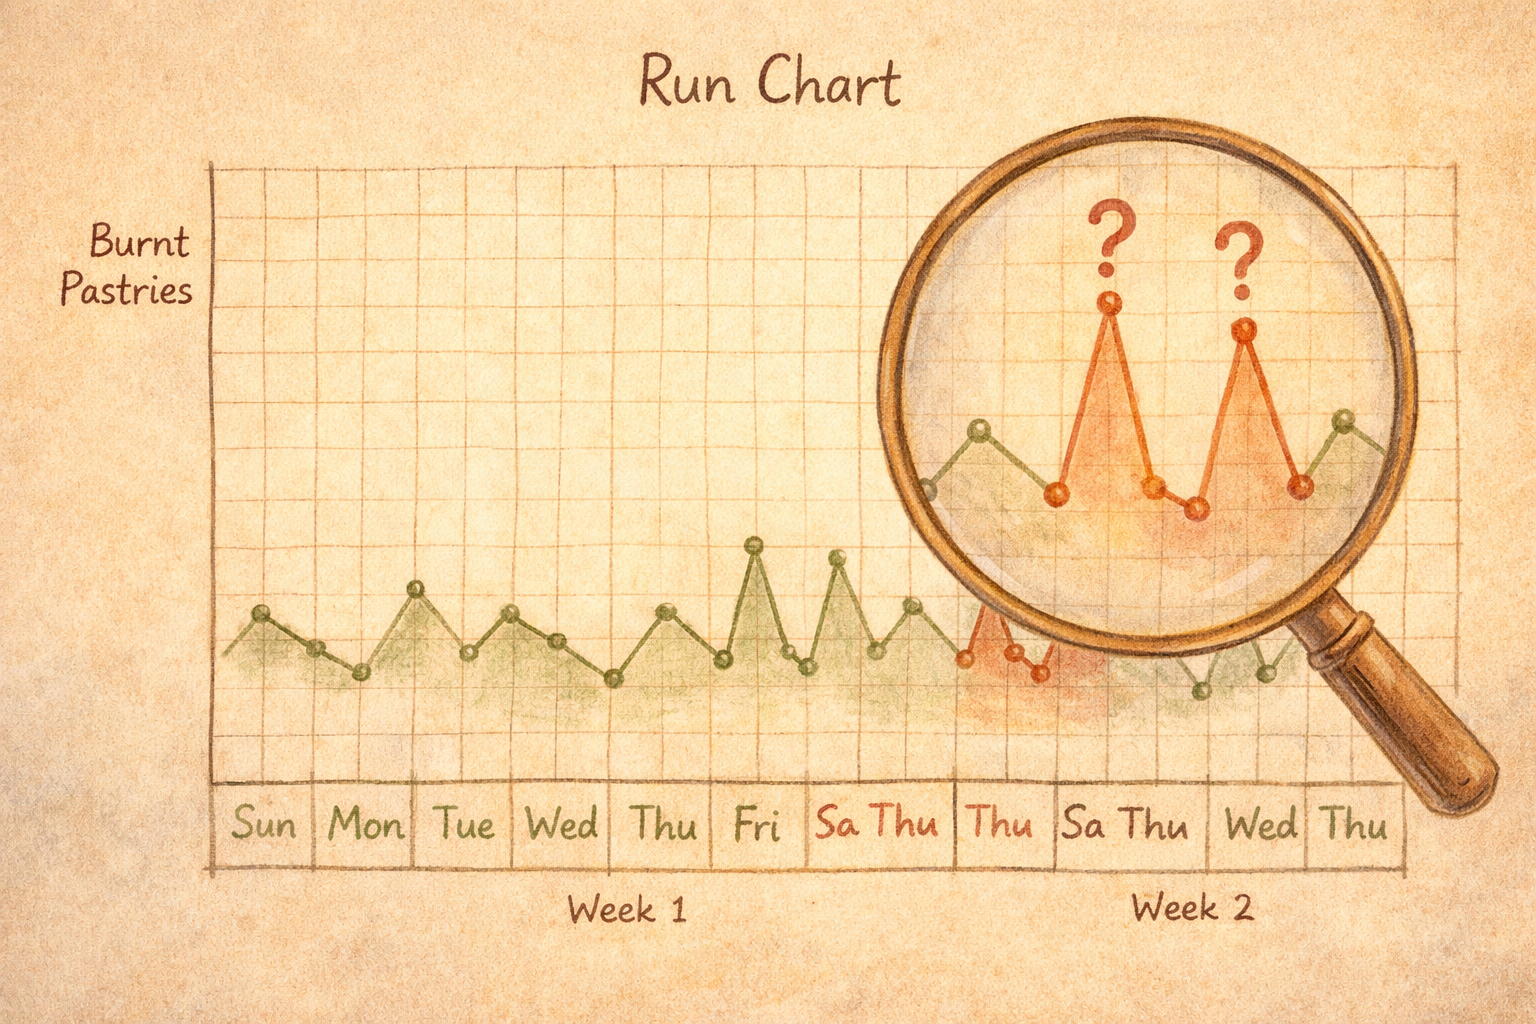
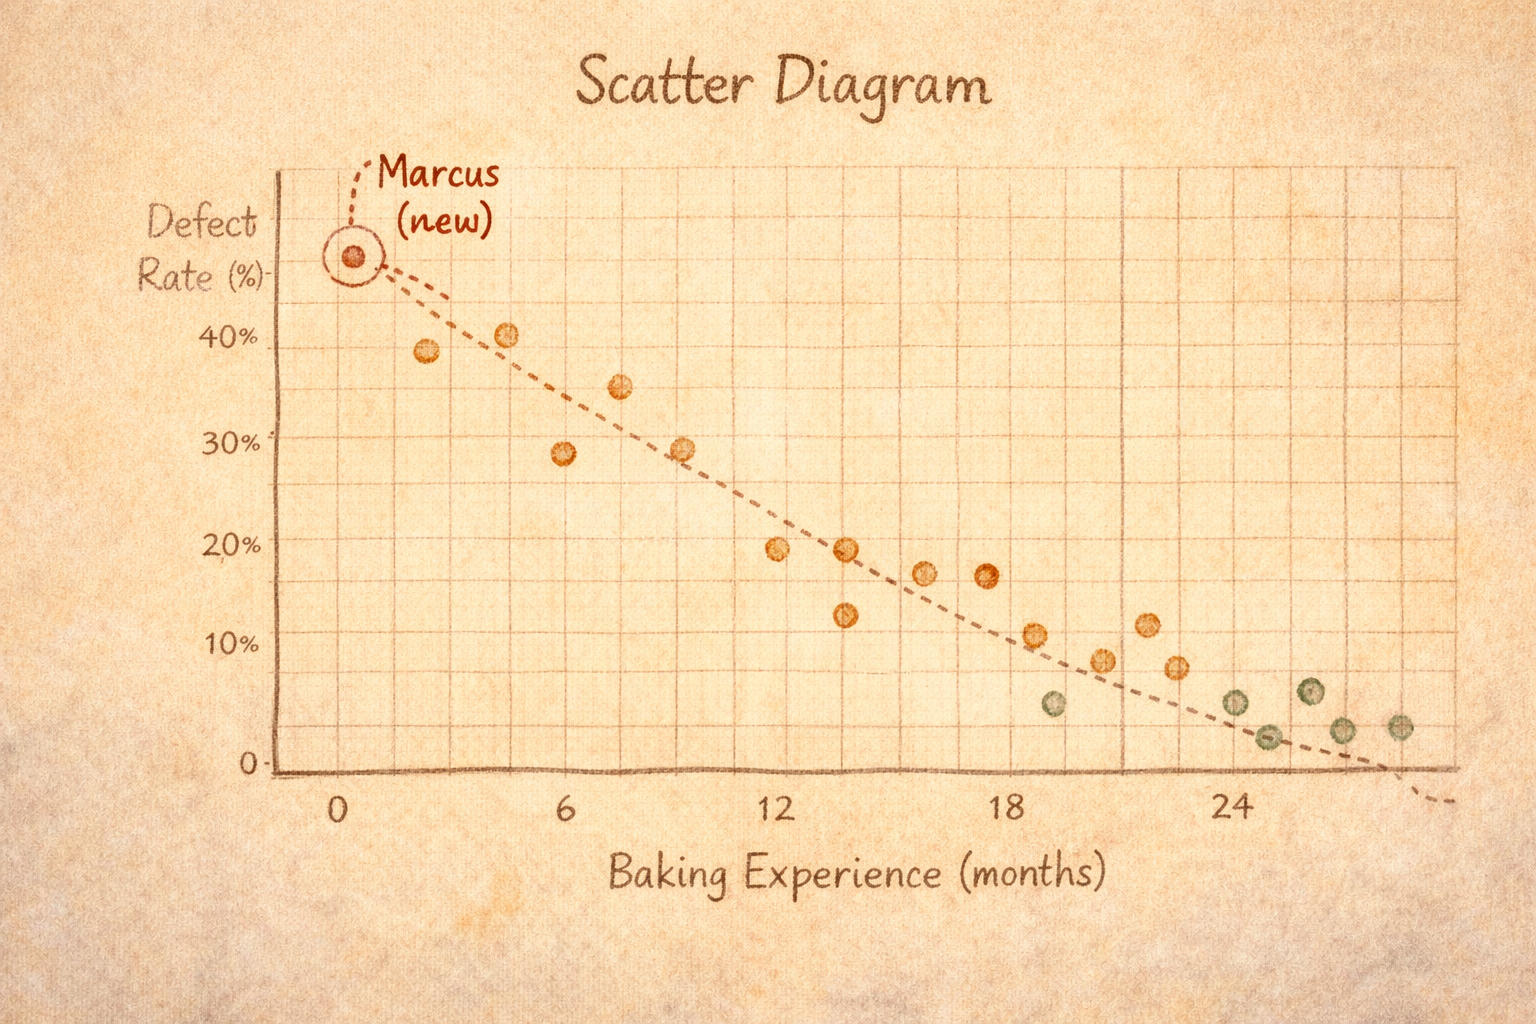
Reduce defects and variation through data, structured analysis, and control.
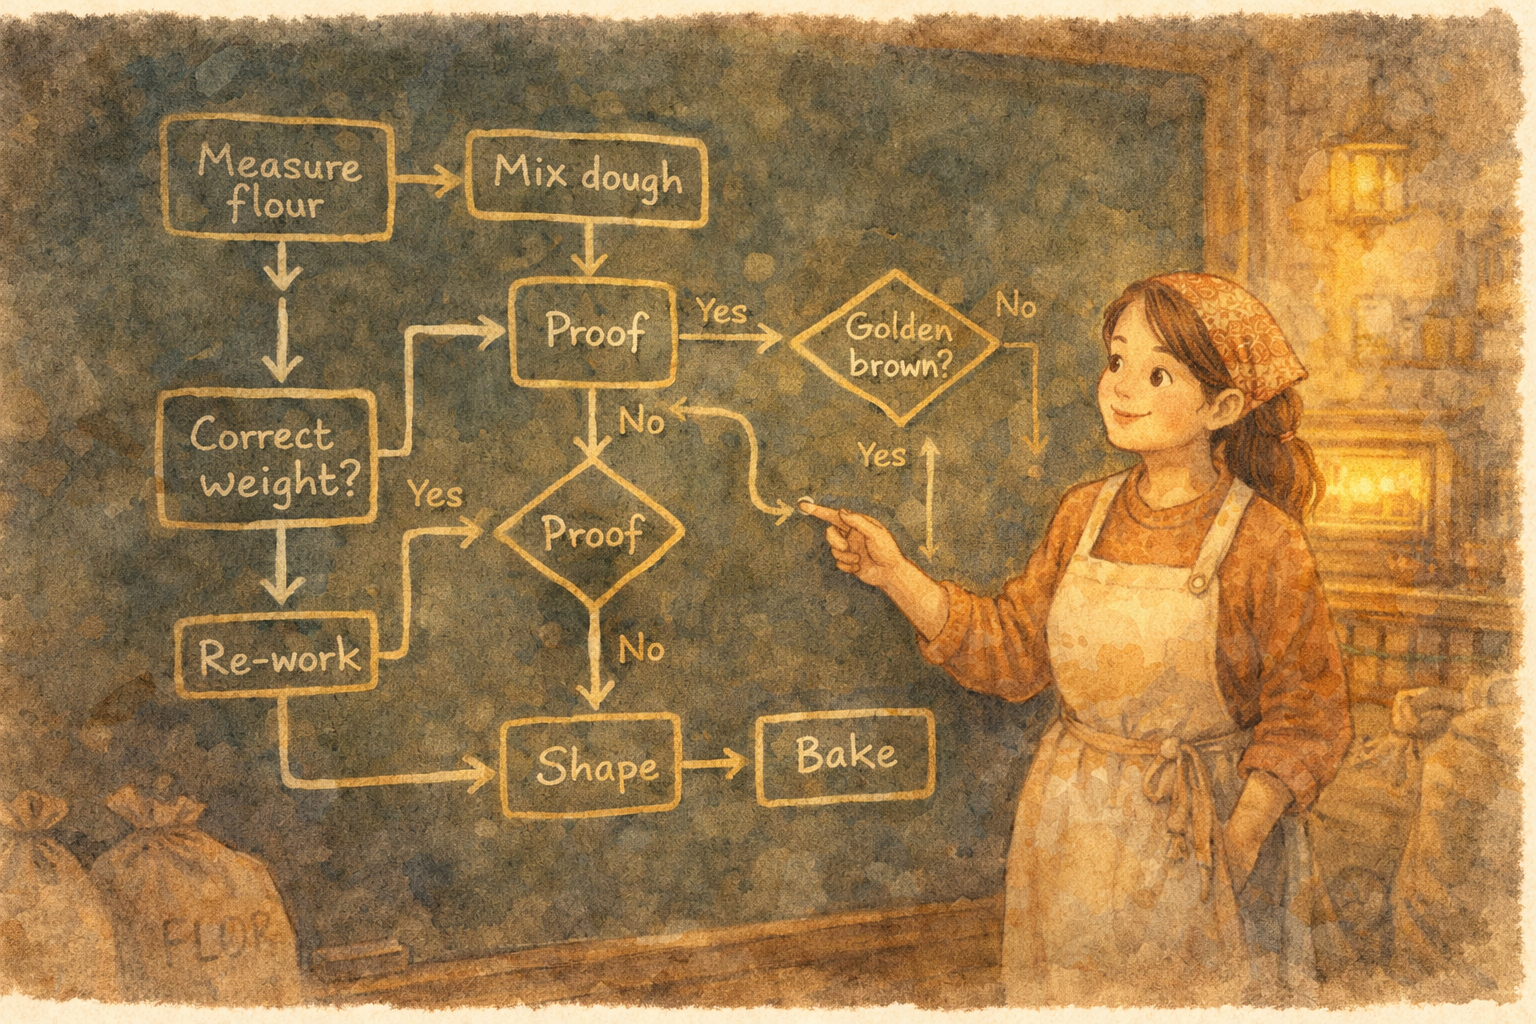
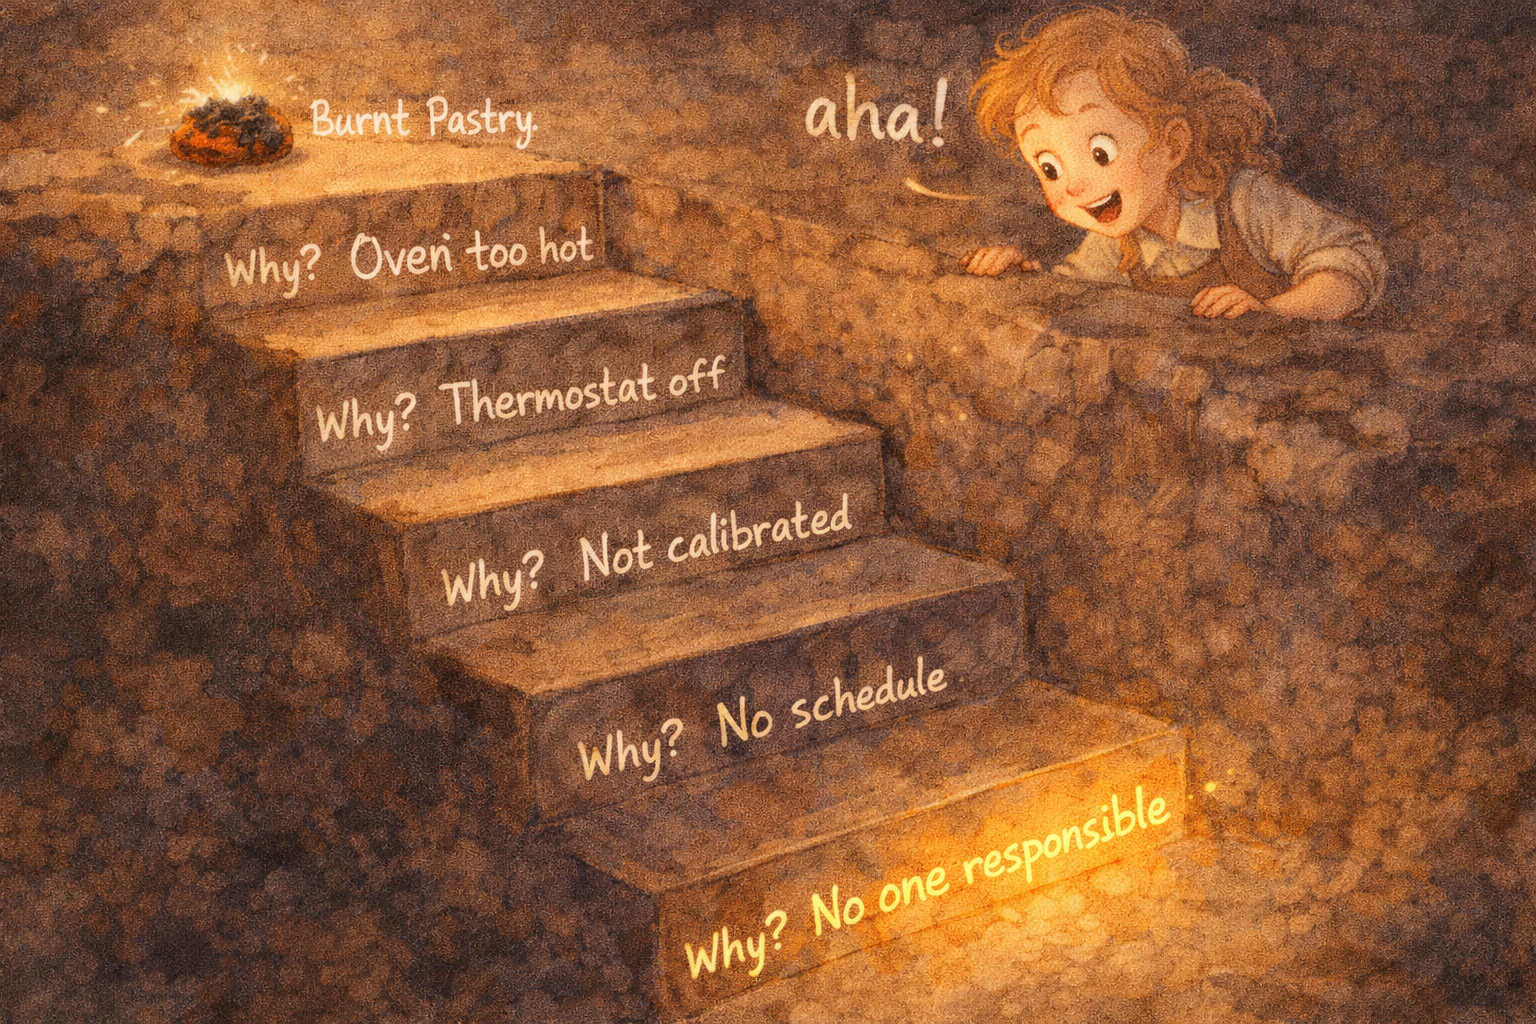
DMAIC Define, Measure, Analyze, Improve, and Control a problem systematically.
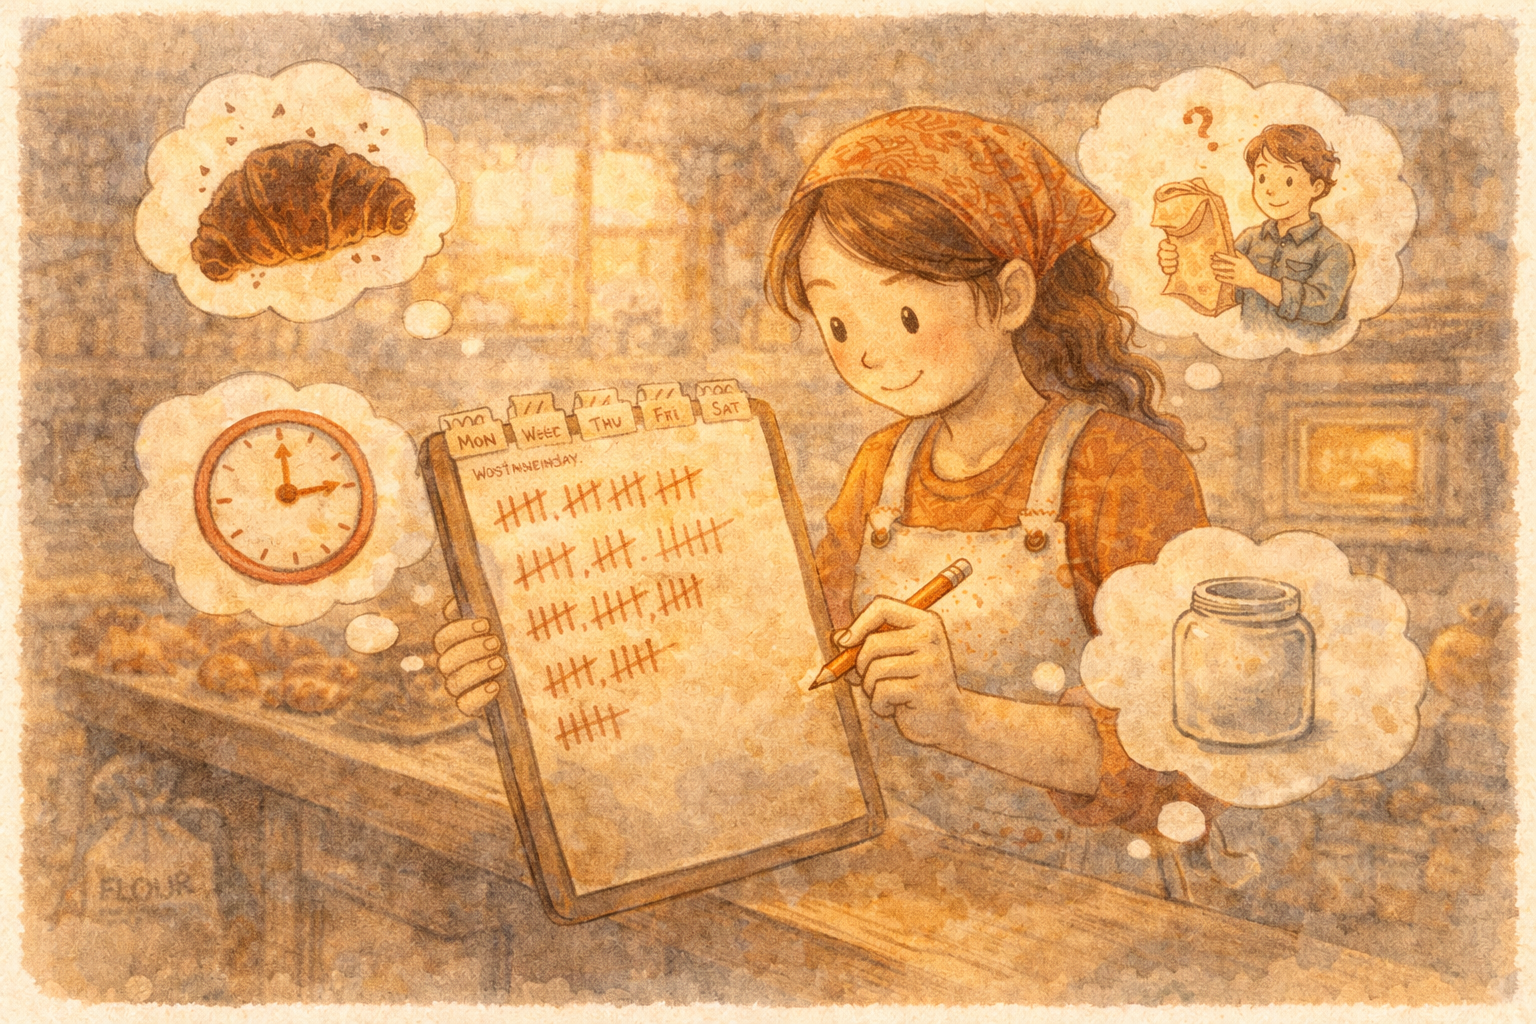
Kaizen Build a culture of continuous improvement through small, repeatable gains.
Visual Navigation

Jump by chapter image

Use the illustrated chapter cards below to move through the story visually. Each card links directly to its chapter section.

Chapter One

The Bakery That Never Sleeps

The problem appears

On a quiet street that smelled like cinnamon and possibility, Luna's Midnight Bakery once felt magical. Luna had built it with her grandmother's sourdough recipe, a second-hand oven, and a belief that the world needed warm bread at midnight.

Then the cracks started to show. Croissants came out lopsided. Flour covered every surface. Orders got mixed up. Customers waited too long. On one especially painful Tuesday, a wedding cake left the bakery with "Happy Birthday, Greg" written across it.

Luna: "Something has to change. But I don't even know where to start."

Behind the old oven, Luna found a note from her grandmother telling her to follow the path of the Seven Friends. They would help her see what was really happening, uncover the root of each problem, and improve the bakery one small step at a time.

On the back of the letter were two cryptic words: DMAIC and TIMWOOD.

Chapter Two

The Flowchart: Mapping the Midnight Maze

Define the process

At 12:01 AM, Luna's first guide arrived: the Flowchart. Before fixing anything, Luna had to understand the full journey from raw flour to finished order.

Together, they traced every step on the bakery chalkboard, including decision points, handoffs, and loops. Luna was stunned to see that a single loaf of sourdough required 47 steps.

Flowchart: "Before you can fix anything, you need to see the whole journey."

Quality tool focus

A flowchart helps teams visualize sequence, rework, delays, and unclear ownership. It often reveals hidden complexity long before anyone touches the data.

Chapter Three

The Check Sheet: Tallying the Truth

Measure with facts

The Check Sheet arrived with a clipboard and a pencil. For one full week, Luna logged every wrong order, burnt batch, late delivery, shortage, and equipment breakdown.

By Friday, the bakery had a factual picture instead of vague frustration: wrong orders happened 23 times, burnt pastries 18, late deliveries 14, ingredient shortages 9, and breakdowns 4.

Check Sheet: "Before you can improve anything, you need facts, not feelings."

What students should notice

This chapter introduces the mindset behind Measure in DMAIC. Improvement begins when recurring issues are recorded consistently enough to compare and prioritize.

Chapter Four

The Pareto Chart: Finding the Vital Few

Prioritize the biggest sources

The Pareto Chart reorganized Luna's tally data from most frequent to least frequent. Suddenly the pattern was clear: wrong orders and burnt pastries created most of the bakery's pain.

Pareto: "Don't try to fix everything at once. Attack the vital few first."

Then the Histogram added another clue. Burnt pastry times did not form one smooth pattern. Instead, there was a second cluster at much higher bake times, suggesting a specific special cause rather than ordinary randomness.

Quality tool focus

  • Pareto chart: ranks categories by frequency so teams tackle the highest-impact issues first.
  • Histogram: shows the shape of variation and can reveal skew, clustering, or multiple process conditions.
Chapter Five

The Fishbone: Swimming Upstream to the Root Cause

Analyze the cause

Luna and the Fishbone diagram framed the problem as "Burnt Pastries" and sorted possible causes into major categories: people, methods, materials, and machinery or equipment.

Then Luna used the Five Whys. The pastries were burning because the oven was too hot. The oven was too hot because the thermostat was off. The thermostat was off because it had not been calibrated. Calibration had been neglected because there was no maintenance schedule. And there was no schedule because no one owned it.

Luna: "So the burnt pastries aren't really about the oven at all. They're about not having a maintenance system."

Quality tool focus

This is the heart of Analyze in DMAIC: move beyond symptoms, organize causes logically, and keep asking why until process design and ownership issues become visible.

Chapter Six

The Night Watchers: Run Charts, Scatter Diagrams & Control Charts

Understand variation over time

The Night Watchers arrived together. The Run Chart showed that burnt pastries spiked on Thursdays and Fridays. The pattern pointed to a specific staffing condition rather than bad luck.

The Scatter Diagram tested a hunch by comparing baking experience with defect rate. As experience increased, defect rate went down. Then the Control Chart clarified the bigger lesson: some variation is natural, but points outside control limits signal assignable causes that need investigation.

Quality tool focus

  • Run chart: tracks trends, cycles, and shifts over time.
  • Scatter diagram: tests whether two variables appear related.
  • Control chart: separates common-cause variation from special-cause signals.
Chapter Seven

The Seven Gremlins of Waste: TIMWOOD

See waste clearly

At 3 AM, Luna discovered the invisible troublemakers her grandmother had warned her about: the Seven Gremlins of Waste. Each one represented a classic form of non-value-added activity.

  • T - Transport: moving flour bags around for no customer benefit.
  • I - Inventory: stockpiling ingredients that may expire before use.
  • M - Motion: making bakers walk farther because tools are badly placed.
  • W - Waiting: workers standing idle while bottlenecks clear.
  • O - Overproduction: making more than demand requires.
  • O - Over-processing: adding effort the customer will not pay for.
  • D - Defects: rework, scrap, and errors that damage quality.
Luna: "They've been here this whole time. In every corner of my process."
Chapter Eight

The 5S Cleanup Crew & the Spirit of Kaizen

Improve the workspace

To push back against waste, Luna welcomed the 5S cleanup crew.

  • Sort: remove what does not belong.
  • Set in Order: place needed items where they are easiest to use.
  • Shine: clean so abnormalities become visible quickly.
  • Standardize: document the best-known way to work.
  • Sustain: make the new habits stick every day.

As the kitchen became cleaner and more consistent, Luna also encountered the spirit of Kaizen: improvement does not have to arrive as a giant breakthrough. It can happen through steady, disciplined refinement.

Chapter Nine

The Mistake-Proof Spell: Poka-Yoke

Prevent human error

Luna knew that even a cleaner process still depended on people, and people make mistakes. The answer was not blame. It was design.

She introduced color-coded measuring cups, automatic oven timers, printed customer names on order tickets, and ingredient bins arranged in recipe order so steps would not be skipped.

Luna: "It's like building gentle guardrails. Not punishing people for mistakes, preventing the mistakes from happening in the first place."

Quality tool focus

Poka-Yoke means mistake-proofing. The goal is to make the correct action easier, the wrong action harder, and failure visible before it reaches the customer.

Chapter Ten

Counting the Cost and Preventing the Next Crisis

Invest in prevention

With the bakery stabilizing, Luna looked beyond defects and asked what poor quality was truly costing her business. She organized the answer into four buckets.

  • Prevention costs: training, maintenance, and better systems that stop defects before they happen.
  • Appraisal costs: inspections, audits, and checks used to evaluate quality.
  • Internal failure costs: defects found before the customer sees them, such as scrap or rework.
  • External failure costs: defects that reach the customer, leading to refunds, lost trust, and reputation damage.

Luna also learned two forward-looking tools. FMEA helped her anticipate failure modes before they happened, and DOE helped her test multiple variables together instead of changing one factor at a time.

Chapter Eleven

The Sunrise: Lean Six Sigma and Happily Ever After

Bring the systems together

As morning arrived, Luna understood that the night had not been about one magic fix. It had been about combining complementary mindsets.

Lean helped her remove waste, improve flow, and build continuous improvement habits through TIMWOOD, 5S, Kaizen, and PDCA thinking. Six Sigma helped her reduce defects and variation with DMAIC and the Seven Quality Tools.

Together, they formed Lean Six Sigma: speed and waste reduction from Lean, combined with data discipline and defect reduction from Six Sigma.

"It was never about one magic tool. It was about all of them working together, and the mindset of always getting a little better."

Quick Reference

Use this section as a study guide after reading the story. It pulls the main ideas into a faster review format without losing the practical language of the bakery example.

DMAIC in Luna's bakery

Define: clarify the bakery problems and the customer impact.

Measure: capture defect data with a check sheet.

Analyze: use Pareto, Fishbone, Five Whys, and data relationships to find root causes.

Improve: redesign work using 5S, Poka-Yoke, training, and better layout or scheduling.

Control: use charts, standards, maintenance routines, and visual management to hold the gains.

The Seven Quality Tools

Flowchart: maps process steps and decision points.

Check Sheet: structures data collection at the source.

Pareto Chart: highlights the biggest contributors first.

Histogram: displays the distribution of variation.

Fishbone Diagram: organizes possible causes logically.

Scatter Diagram: explores relationships between variables.

Run / Control Charts: show trends over time and distinguish normal from special variation.

TIMWOOD wastes

Transport, Inventory, Motion, Waiting, Overproduction, Over-processing, and Defects are classic Lean signals that value is being lost somewhere in the process.

Transport Inventory Motion Waiting Overproduction Over-processing Defects

5S and continuous improvement

Sort, Set in Order, Shine, Standardize, and Sustain work best when they are not treated as a one-time cleanup event. Their long-term value comes from daily discipline and shared expectations.

Kaizen reinforces that habit by treating improvement as ongoing work, not an occasional rescue mission.

Poka-Yoke examples from the story

Color-coded measuring cups, automatic shutoff timers, printed customer names, and recipe-order ingredient bins all reduce the chance that a routine human slip turns into a customer-facing defect.

Cost of quality

Prevention is the smartest spend because it reduces future appraisal, internal failure, and external failure costs. That is why training, calibration, and simple safeguards often pay back more than they first appear to.